A TUI dashboard
for local services
Start, stop, and monitor all your services from the terminal. Dependency-aware startup, real-time logs, health checks.
https://github.com/zlj-zz/muster
12 services loaded | 3 groups | 4 env checks
See it in action
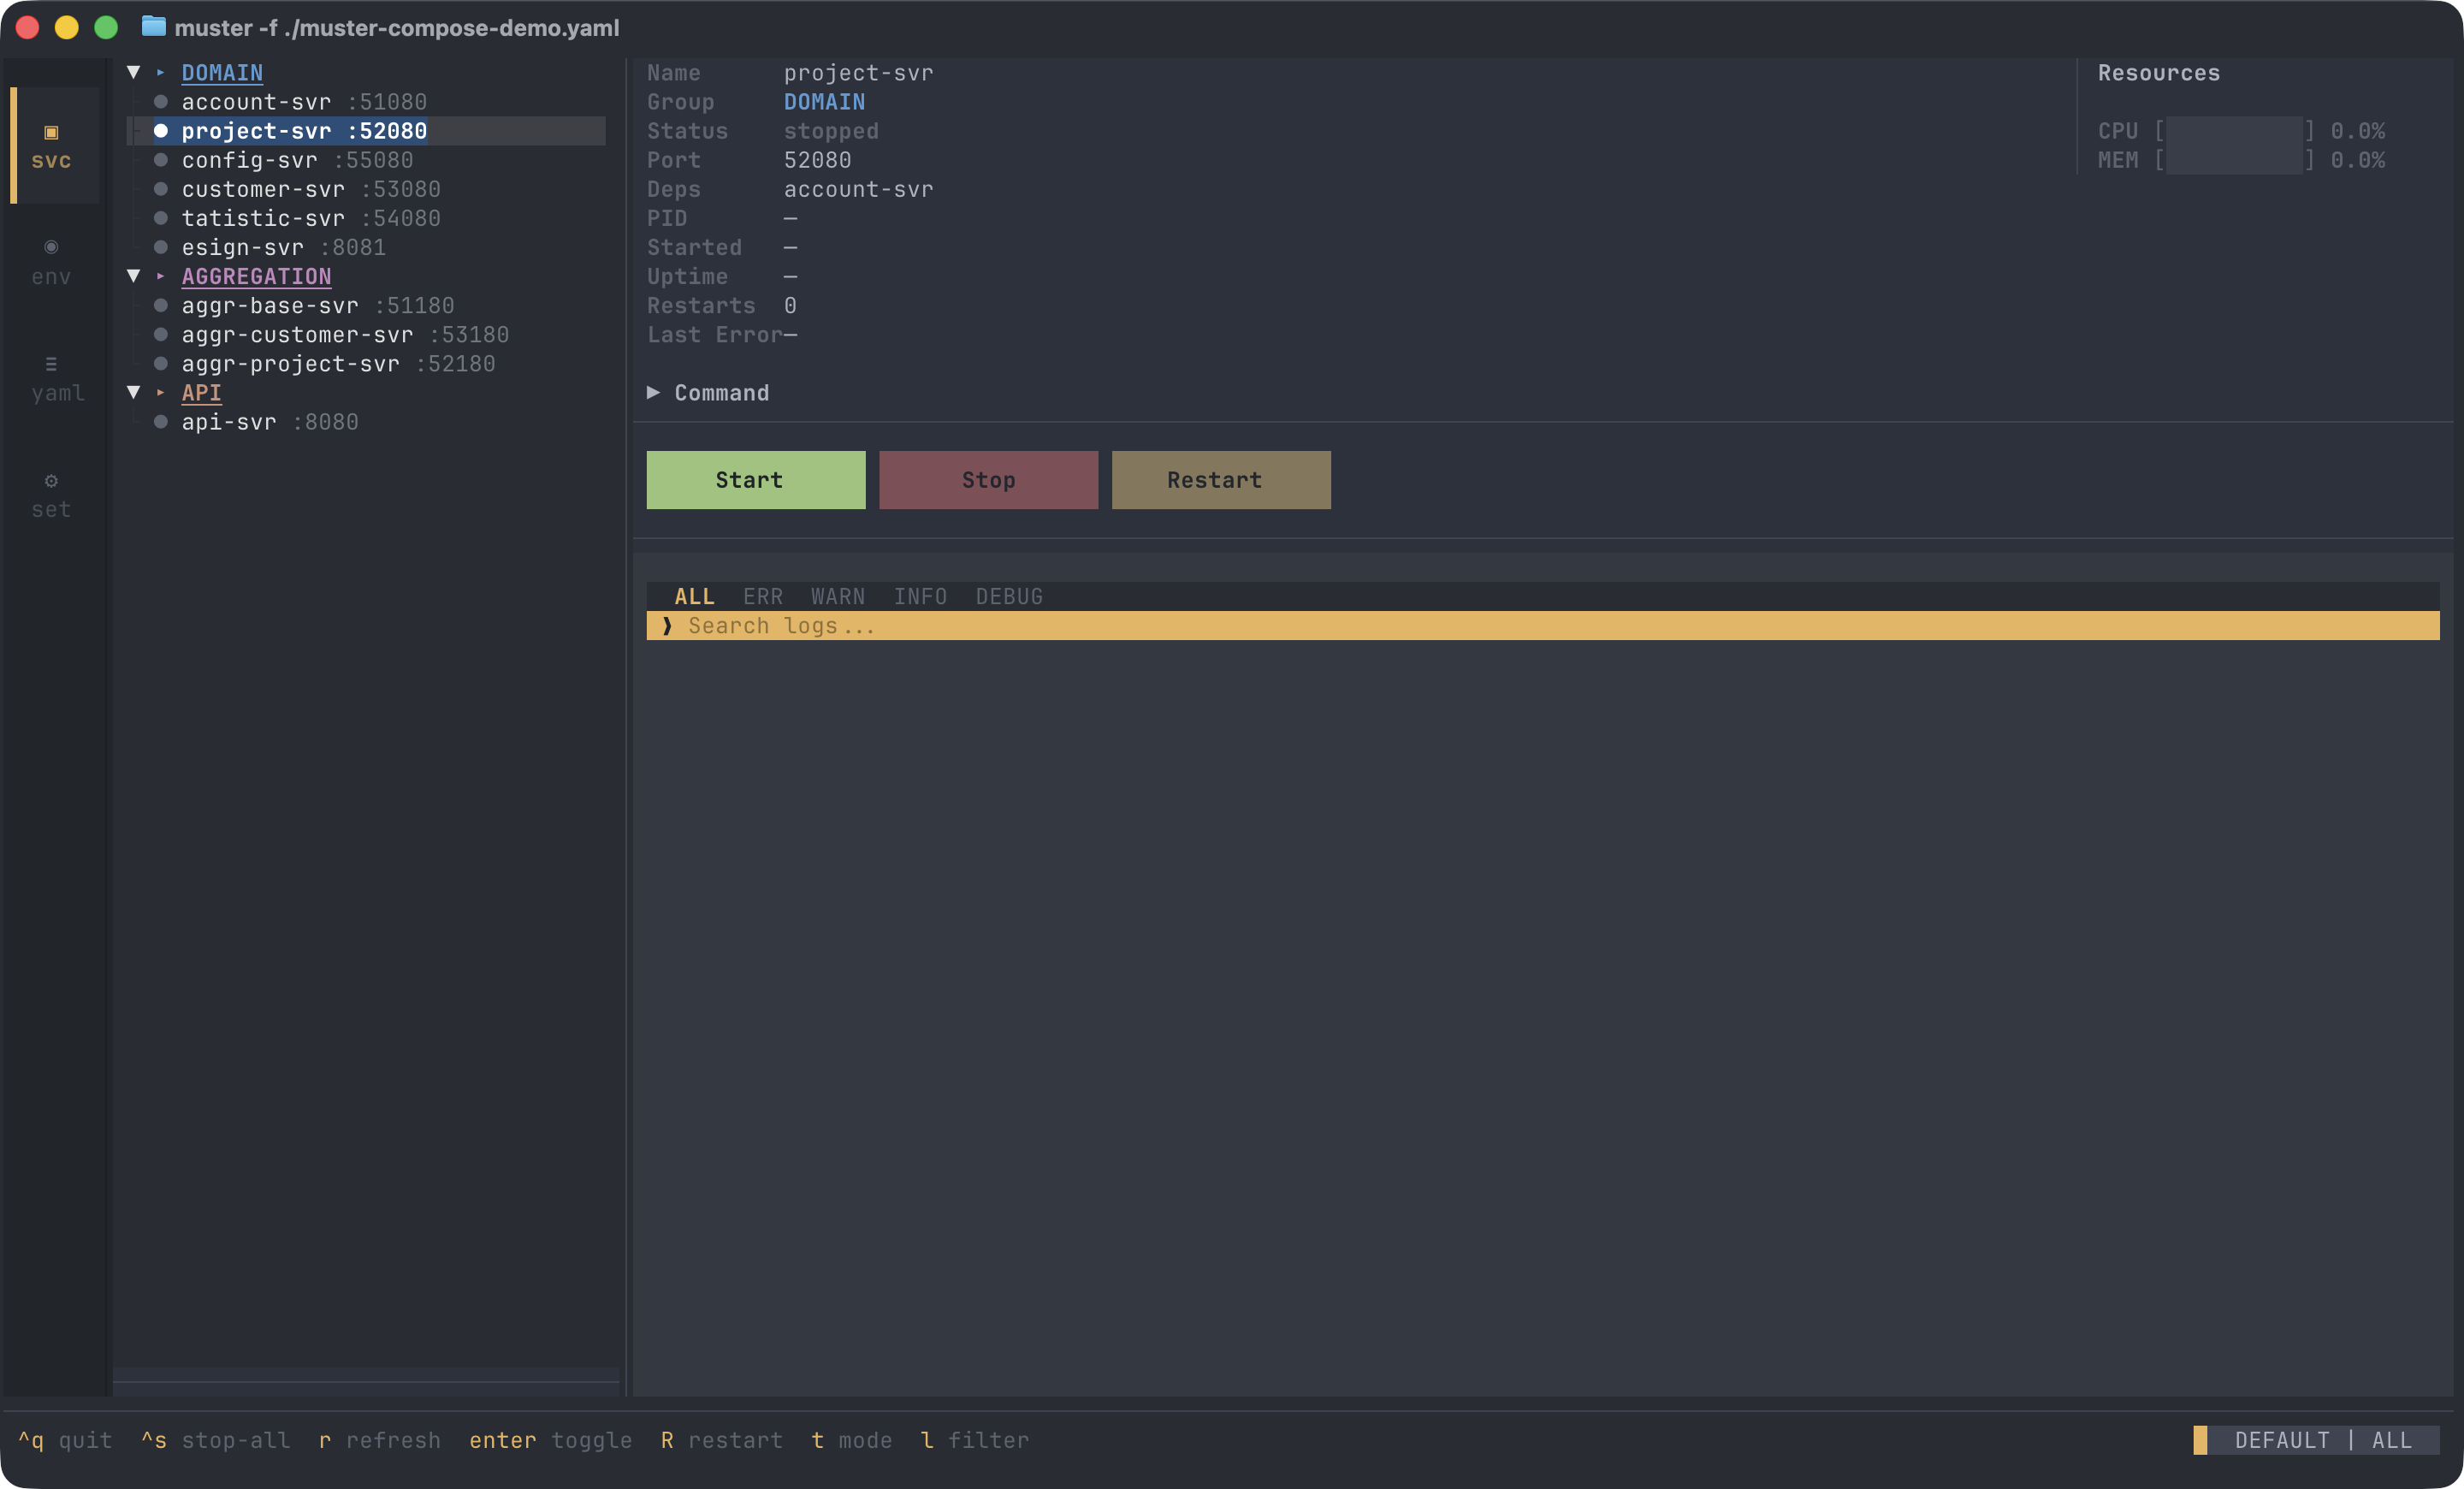
Your services, visualized
muster renders a live dashboard in your terminal. Tree view, detail panels, logs, resource usage — all at a glance.
Features
Built for developer workflows
Tree View
Services grouped by configurable categories with dynamic colors and live status indicators.
Dependency Startup
Auto-resolves service dependencies and starts them in the correct topological order.
Real-time Logs
Per-service log streaming with auto-scroll, syntax highlighting, and copy support.
Health Checks
TCP, HTTP, and process health monitoring with latency measurement and status bar indicators.
Environment Monitor
Live indicators for etcd, MySQL, Redis, or any custom TCP/HTTP dependency.
Command Modes
Each service can define default, test, prod, or custom command maps. Cycle modes with one key.
Installation
One command away
Requires Python 3.10+. One-liner install from GitHub.
$ curl -fsSL https://raw.githubusercontent.com/zlj-zz/muster/main/install.sh | bash
muster installed: ~/.local/bin/muster

$ muster -f muster-compose.yaml
TUI dashboard running. Press '^q' to quit.